Abstract
There has been increased interest in reducing energy consumption during SMT assembly over the past few years. Increasingly, the environmental, financial, and regulatory effects have been demanding new innovations. Low-temperature solder alloys have also been of increased interest to the SMT industry for a variety of reasons including component sensitivity, step soldering, and reduced energy consumption. However, while the reduced temperature and subsequent energy during reflow have often been listed as a benefit, it has rarely been publicly quantified. In this paper, we quantify the effect of reduced temperature on oven energy usage by recording the actual consumption rate of an oven under different reflow conditions. The demonstrated reduction in oven energy consumption may then be used by manufacturers to evaluate trade-offs and benefits of low-temperature solders.
Introduction
Energy consumption during the printed circuit board (PCB) assembly process is both an overhead cost and, increasingly, an environmental concern that impacts the overall carbon footprint of a manufacturing site. If energy consumption is considered only as a final overhead, opportunities to reduce energy usage may not be readily identified. The energy consumption of a facility is distributed not just between different circuit boards as are materials or components, but also between various necessary pieces of equipment used during manufacturing in addition to the general facility. In order to address the goal of overall energy reduction, it is both possible and feasible to reduce the energy consumption requirements of the reflow oven—one of the most significant in the process—by modifying the profile.
When a PCB assembly process is limited to a standard Pb-free SAC alloy, the impact of possible reflow modifications on oven energy consumption may generally be ignored in favor of reliability-focused modifications. The peak temperature, ramp rate, time above liquidus, and soak parameters are all critical elements controlling the reflow process and preventing defects such as head-in-pillow, tombstoning, voiding, solder balling, etc. [1]. Capturing the environmental and cost benefits of reduced energy consumption can be most readily accomplished when transitioning from a profile compatible with SAC-type solder alloys to one used with low- or mid-temperature solders.
Current applications using low- and mid-temperature solders have primarily made the selection based on technical requirements such as warpage, large ∆T challenges, CTE mismatch, step soldering, or temperature sensitive components, and accepted energy reduction effects as a positive and unrecorded secondary benefit [2]. As global regulations, carbon footprint, and energy costs become larger factors, the importance of quantifying energy savings as part of an overall process evaluation increase.
Experimental Methodology

Many different factors interact when determining the energy consumption of a reflow oven. A purely mechanical evaluation of oven parameters, such as zone temperature and belt rate, could easily capture large volumes of data that does not correlate to practical reflow profiles. During this study, 11 reflow profiles were identified, and the oven settings were adjusted to achieve those profiles. Details of the reflow profiles are shown in the Appendix. The temperature profiles were recorded using thermocouples attached to a 150mm x 250mm x 1.6mm board as shown in Figure 1. Figure 2 shows the configuration of the 10-zone 1936MK7 N2 reflow oven that was used.
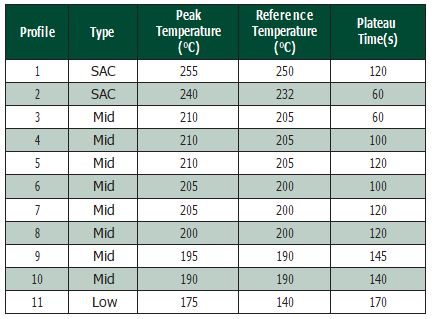
Two profiles were created to capture the difference between the extremes of acceptable profiles used to reflow SAC-type solder alloys with a 220°C liquidus. The lowest temperature profile has a peak temperature commonly used with near eutectic BiSn-type solder alloys. The remaining eight profiles were chosen to characterize the growing mid-temperature solder space with peak reflow temperatures ranging from 190–210°C. Emerging technologies allow for enhanced reliability under reduced reflow conditions, and typically require plateau shaped profiles defined by time at or near the peak temperature rather than by a liquidus temperature [3]. The Reference Temperature in Table 1 identifies the temperature above which either a plateau time is recorded or the Time Above Liquidus (TAL) is recorded.
Table 1. Oven Zone Temperature Settings
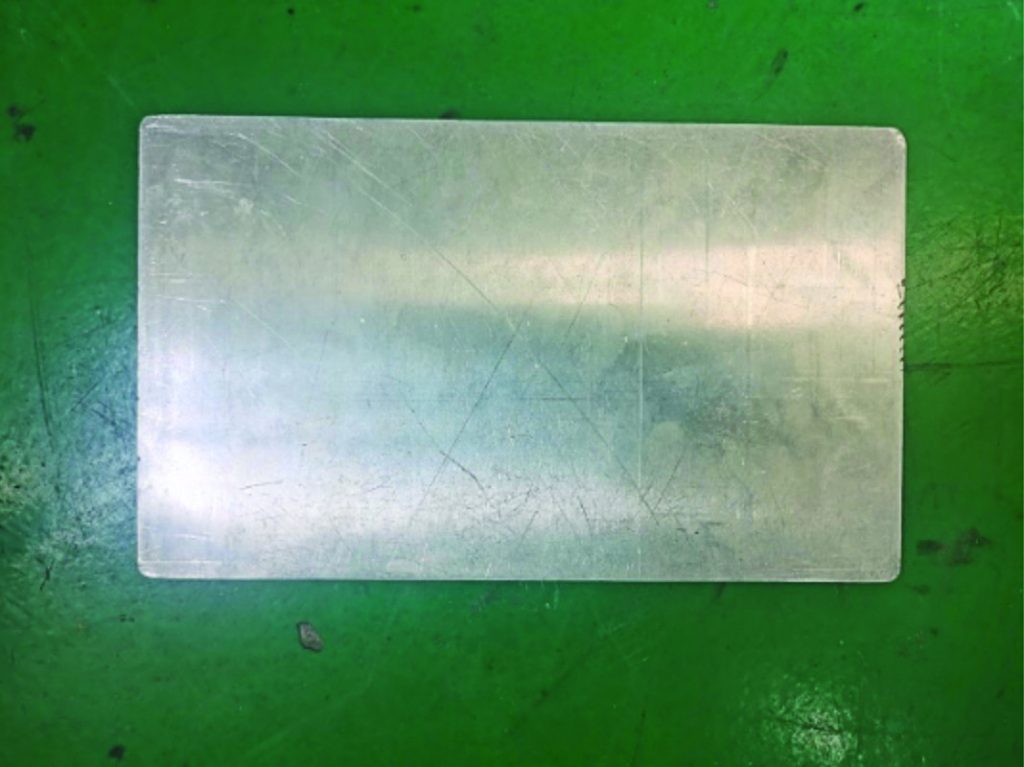
In addition to the oven zone temperature settings, two additional variables were included in the experiment matrix—the presence of a load in the oven acting as a thermal mass shown in Table 2, and the atmosphere as shown in Table 3. Aluminum boards, as shown in Figure 3, were placed in the oven with 300mm spacing for both loading conditions. During testing, the oven settings were kept constant under the different loading conditions.

Table 2. Presence of Load in Oven

Table 3. Atmosphere

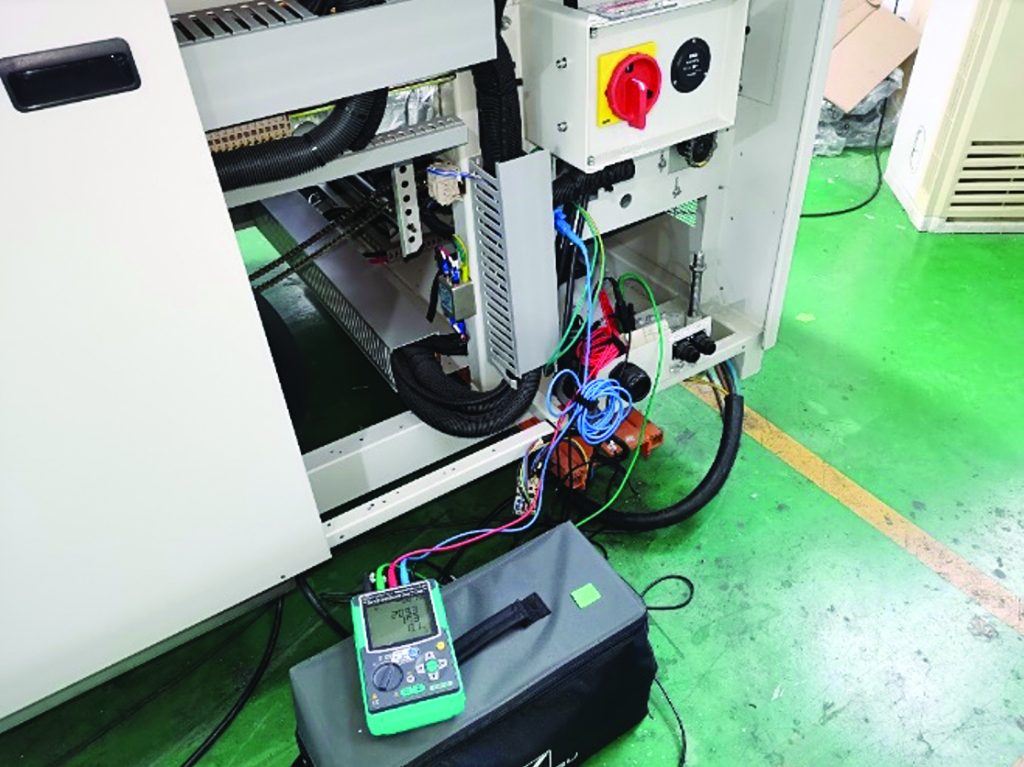
The rate of electrical consumption was measured in kW in 15-minute intervals for each condition using a multimeter, shown in Figure 4. The average of the 15-minute energy consumption rate was recorded for analysis
Results
During initial qualitative evaluation, the variation in atmosphere via the addition of nitrogen appeared to have a minimal effect on the overall oven power consumption shown in Figure 5. Thirty-three conditions were evaluated when atmosphere as a factor was excluded. In only two of the 33 conditions, the spread between maximum and minimum power consumption was greater than 0.5kW. Those two conditions were outliers as the average spread was 0.253kW between maximum N2 and standard atmosphere shown in Table 4. This impression was quantitatively confirmed using a Tukey-Kramer and Anova analysis which showed increased energy consumption as nitrogen was increased; the differences in oven energy consumption caused by air atmosphere were not practically significant. The difference in mean energy consumption between an air atmosphere and one controlled to 100ppm of O2 was 2%. The manufacture, storage, and shipping of nitrogen for atmosphere control had its own cost and energy implications. However, for the purposes of the oven energy consumption analysis in this study, the four data points representing each atmosphere condition were combined while the impact of loading and profile was analyzed.
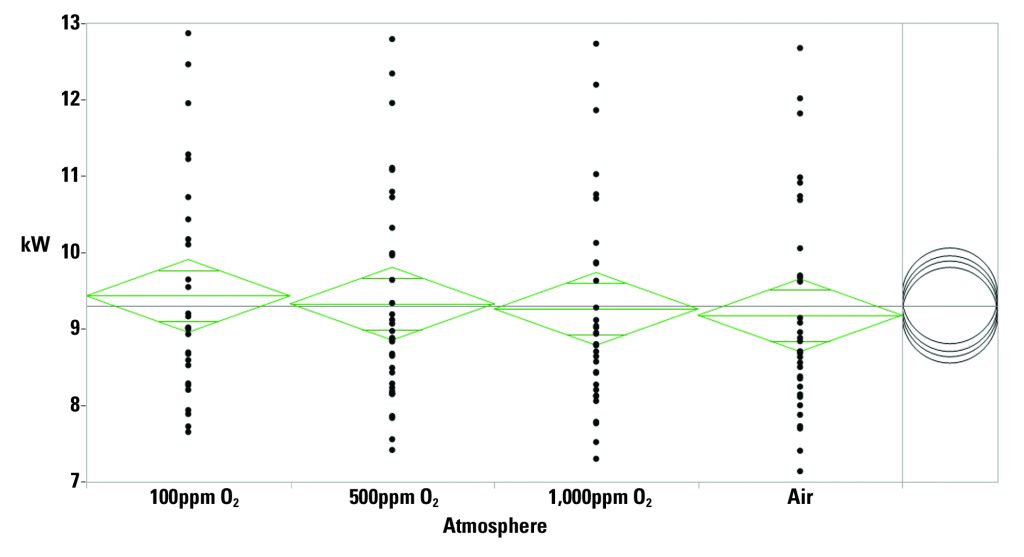
Table 4. Mean Energy Consumption Per Atmosphere Condition

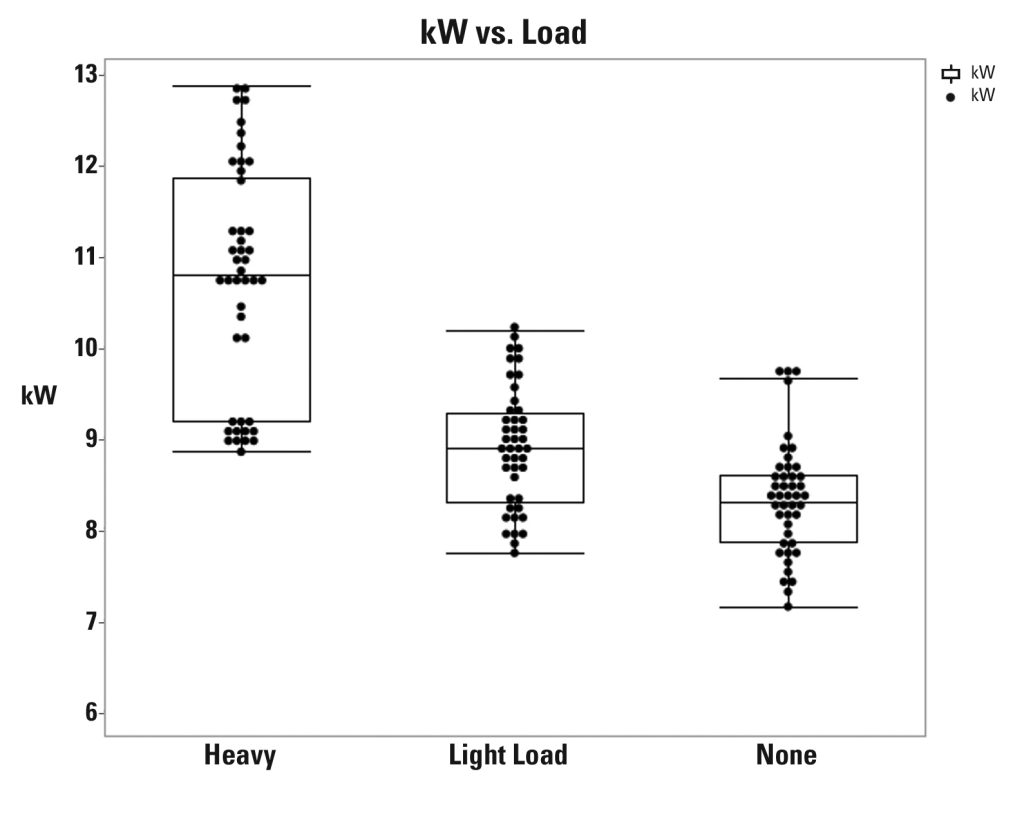
Both the load and the profile had the potential to meaningfully impact oven energy consumption. Separating all energy consumption data points by loading alone in Figure 6 immediately demonstrated a trend between heavier loading and higher energy consumption. On average, transitioning from a heavy load to zero loading of the oven reduced the energy consumption by 23%. However, not only were there other drivers controlling board design and oven loading during manufacture, but also an oven that was unloaded consumed energy without producing any product. The effect of oven loading is unlikely to be useful in isolation. Instead, the impact of oven loading is a valuable consideration when evaluating the energy consumption of different reflow profiles.
Of the 11 reflow profiles tested, there were eight different peak temperatures represented, as shown in Table 1. The three different profiles with a peak temperature of 210°C and the two profiles with a peak temperature of 205°C appeared to have contributed to widespread energy consumption for those peak temperatures, in particular under heavy loading, as shown in the top panel of Figure 7. Despite the variation within individual groupings, the trend for all loading conditions supported the hypothesis that lower temperature reflow oven profiles could reduce energy consumption. Moving from a 240°C profile applicable to most SAC solders to a profile using a peak temperature of 205°C is roughly equivalent to a 10% energy reduction as shown in Table 5.
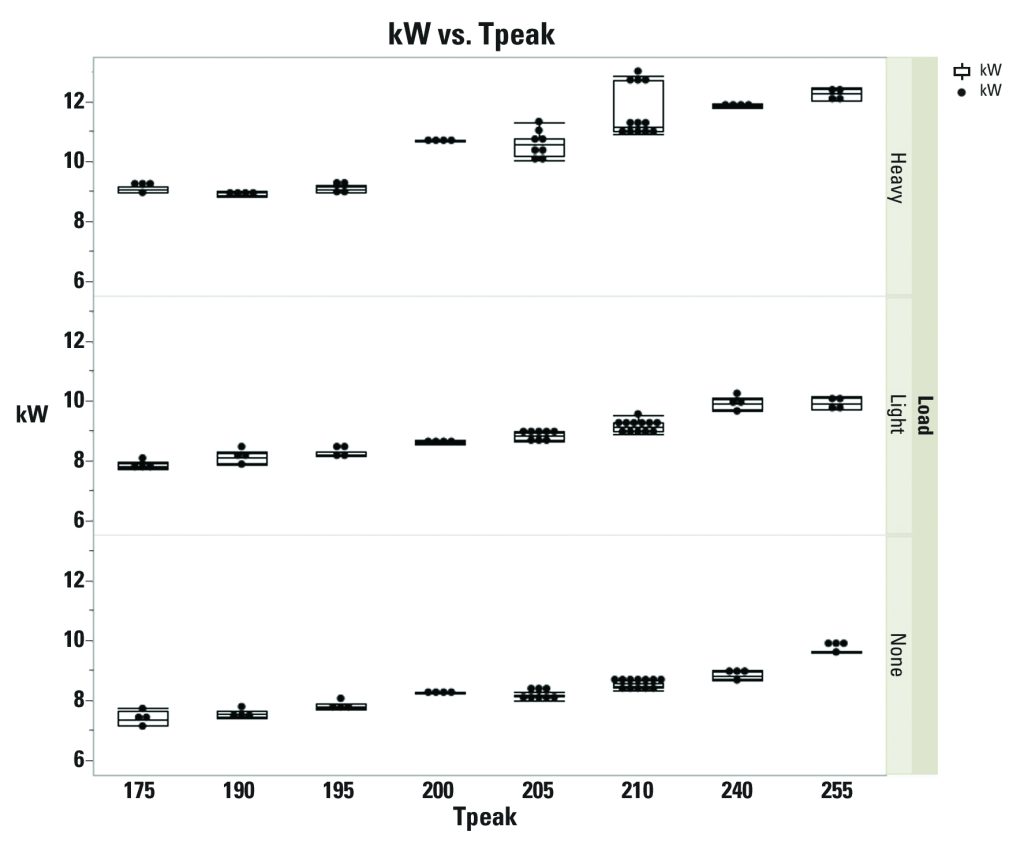
Table 5. Average Energy Consumption for 205°C vs. 240°C Reflow Conditions

The spread between profile variations using the same peak temperature was significantly reduced under light or no loading conditions but could still be analyzed more clearly by evaluating each profile individually.
In Figure 8, the profiles were separated by both peak temperature and also the plateau time during which they were at or near the peak temperature. The measurements taken under the different atmosphere conditions were grouped together as discussed previously. Noticeably, despite similar overall trends between temperature and energy consumption, the effect of different profiles varied between the three loading conditions.
The three profiles in Figure 8 were organized within each peak temperature grouping from the longest to shortest plateau time. In the middle chart of Figure 8, under light loading conditions, there was a correlation between a shorter time at peak temperature and an increased energy consumption.
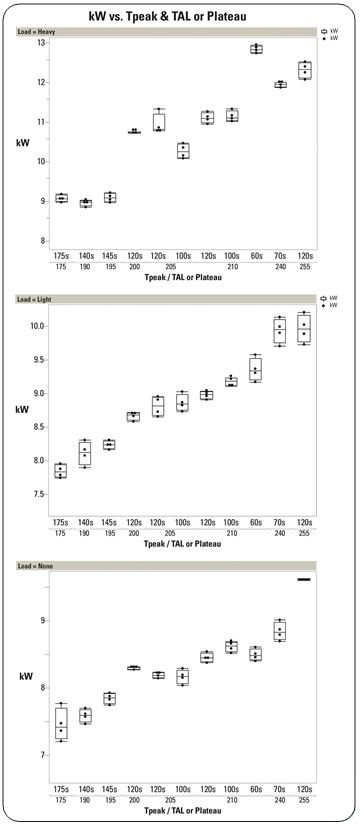
Under heavy loading conditions shown in the top chart of Figure 8, the results were inconsistent; the results for the three profiles reflowed at 210°C roughly aligned with the trend seen under light loading but did not apply to the 205°C profiles tested. The 210°C profile with a 60s plateau time also appeared to indicate that the energy consumption of the lower temperature profile could exceed that of a high temperature SAC profile. This did not fit within the overall trend and prompted the consideration of other factors.
The interaction between oven settings, time at peak temperature, and load were all impacting energy consumption. Modifying the time at plateau required changing settings on the oven, and in particular, typically required modifying the belt rate carrying the PCB or load through the oven. The 210°C profile of note in the top chart of Figure 8 was set up with a belt rate of 100cm/min; in contrast, the next fastest belt rate was that of the 240°C SAC profile at 79cm/min. The stainless steel belt carrying the PCB was itself a heat-sink or thermal load for the oven. However, more significantly for the heavy loading conditions, the oven settings may not have been representative of the actual desired profile conditions. In this test, the oven settings were held constant for each profile condition despite the load. Once the load increased past an undefined point, each zone was not capable of bringing the system up to the target temperature prior to entering the next zone. The effective ramp rate and plateau time varied and, therefore, impacted the energy consumption in unexpected ways. It did not require as much energy to retain the temperature during the plateau as it was to increase the temperature. It is plausible that the 210°C profile with a 100cm/min belt rate never reached a plateau temperature and, therefore, demonstrated energy consumption more similar to that of a SAC profile with a continuous temperature ramp rate. This consideration required further evaluation, and at the very least supported the standard industry recommendation that individual profiles be set up for different board assemblies.
For smaller PCB assemblies, the oven belt could be a more significant thermal load than the circuit board itself. The correlation between plateau time and energy consumption was less clear under the no-loading condition in the bottom chart of Figure 8, but the overall trend in regard to peak temperature versus energy consumption was consistent with expectations.
A plateau profile could be achieved using different combinations of oven settings. The increase in variation caused by heavier versus lighter or no-loading conditions indicated there may be more opportunities to research and optimize energy reduction for low-temperature plateau profiles under heavy loading conditions, such as in applications using fixturing devices.
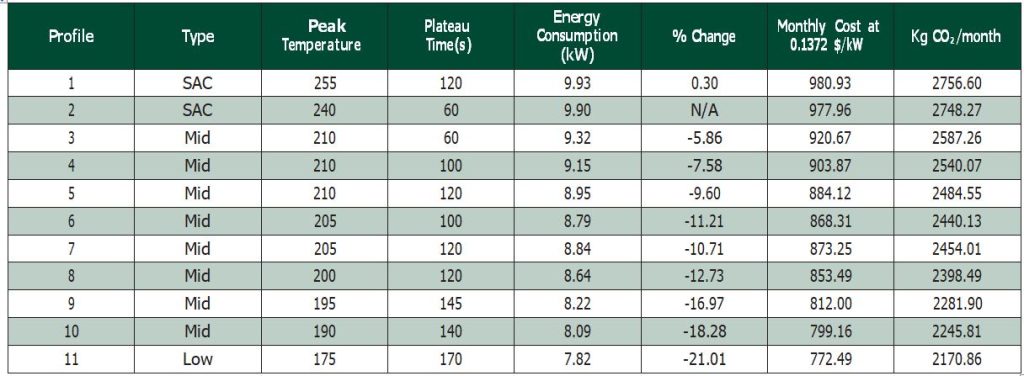
For the purposes of evaluating the use of lower temperature reflow profiles to reduce oven energy consumption in this study, the light loading condition was assumed to be the most representative of PCB assembly processes using the defined profiles. Consistent trends across profile types and the light loading board were expected to experience “actual” profiles similar to those characterized during the oven setup process. The results are shown in Table 6 where the 240°C peak temperature profile is referred to as the baseline condition. The estimated monthly cost and CO2 production for 24/7 operation are based on the USA 2021 and 2020 figures published by the Energy Information Administration [4].
Table 6. Energy Consumption of Profiles Under Light Loading Test Conditions.
Conclusions
The results of this study indicate that mid- and low-temperature reflow profiles can provide an energy reduction between roughly 5–20% that of standard SAC profiles. However, realizing the benefits of reduced energy consumption requires using the appropriate low-temperature solder alloy, and addressing related process changes.
It is critical to evaluate which aspects of reliability are important for the circuit board assembly in question prior to changing the alloy for any reason. The two aspects of reliability most frequently in question when discussing alloy composition are thermal cycling and mechanical reliability. Other concerns, such as electrical reliability, are more likely to be driven by the solder flux properties.
When addressing reliability concerns, it can also be reasonably assumed that component metallizations and BGA ball compositions will be composed of alloys related to SAC. Therefore, manufacturers will need to consider the impact of both using a low-temperature solder alloy independently and also that of using mixed alloy solder joints on assemblies with BGAs. Previous studies of BiSn and InSn low-temperature solders indicate that different levels of mixing can influence both mechanical and thermal cycling reliability [3].
Mechanical reliability is a particular concern when utilizing the lowest temperature profile included in this study. The peak temperature of 175°C is compatible with near-eutectic BiSn solder alloys, which are known for being brittle and susceptible to damage from drop shock. This effect can be mitigated using additional processes such as underfill and corner glue. These processes were not studied in this test but should be evaluated for their impact on the overall cost and energy consumption of the assembly because they require not only additional material, but also may require additional heating steps.
The trade-offs of mid-temperature profiles can vary depending on the solder paste selected. Both indium-containing and bismuth-containing solders can enable reflow between 190–210°C. A subset of indium-containing mid-temperature solders require few, if any, mechanical or thermal cycling reliability trade-offs. However, indium-containing materials do have other relevant properties, such as wetting speed, which may benefit from a nitrogen atmosphere. If N2 is deemed necessary, as with underfill processing, it would be beneficial to evaluate the cost and energy consumption in greater detail.
Low-temperature solder has an incredible potential to reduce the cost and environmental impact of energy consumption during circuit board assembly. As with any process modification, there are challenges to address when converting from SAC to a low-temperature alloy. The testing analyzed in this paper provides a quantitative foundation for manufacturers to consider when evaluating the relative benefits and challenges for their processes.
Future Work
The analysis within this paper serves as an initial guide regarding oven energy consumption under different profile conditions but does not address all possible variables.
Future work could include evaluating multiple different reflow oven models. Additional testing on the impact of different settings of plateau profiles on energy consumption may provide clarity to some of the trends observed in this study. The impact of oven startup and shutdown effects were not considered. The use of N2, while not significant on the energy consumption in the oven, could be evaluated independently both as a cost and as an environmental impact, as could the effect of underfill and corner glue processes.
References
- E. Briggs, R. Lasky, Indium Corporation, “Best Practices Reflow Profiling for Lead-Free SMT Assembly,” SMTA China (Shanghai), 2009.
- Meagan Sloan, et al., “Reflow Profiling or Next-Generation Solder Alloys,” SMTAI, 2018.
- HongWen Zhang, et al., “An Alternative Lead-Free Low- Temperature Solder with Excellent Drop Shock Resistance,” SMTAI, 2020.
- United States Energy Information Administration https://www.eia.gov/todayinenergy/detail. php?id=51438#:~:text=In%202021%2C%20the%20 average%20nominal,our%20latest%20Electric%20Power%20 Monthly.
Profile 1
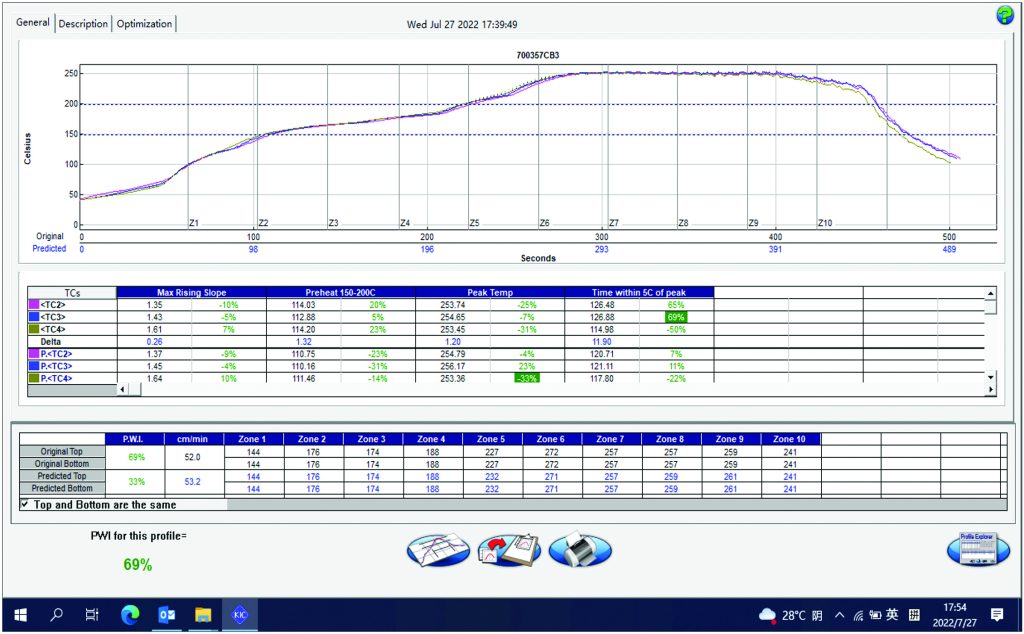
Profile 2
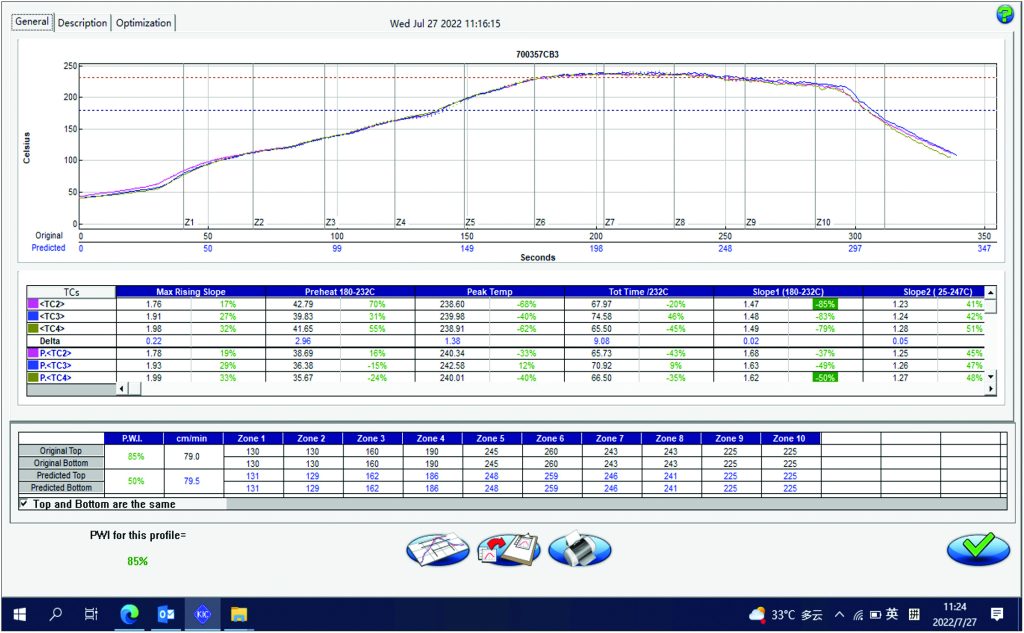
Profile 3
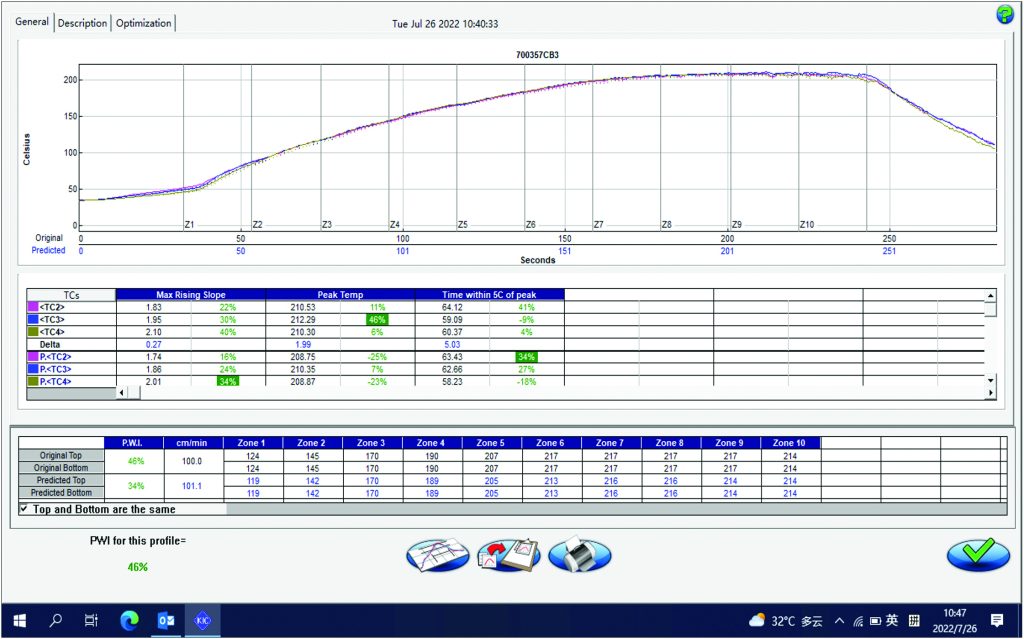
Profile 4
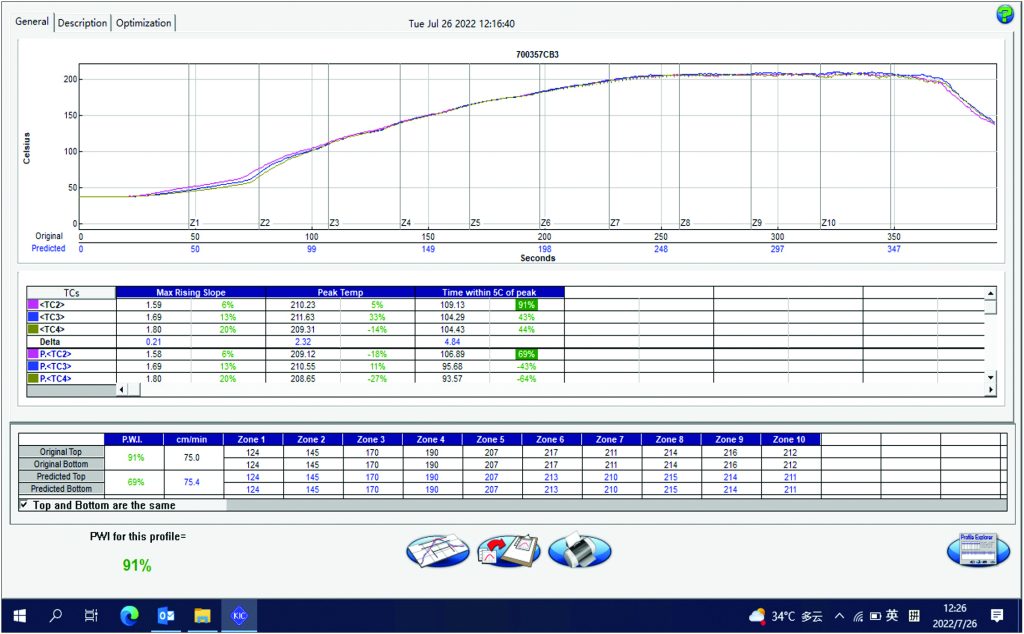
Profile 5
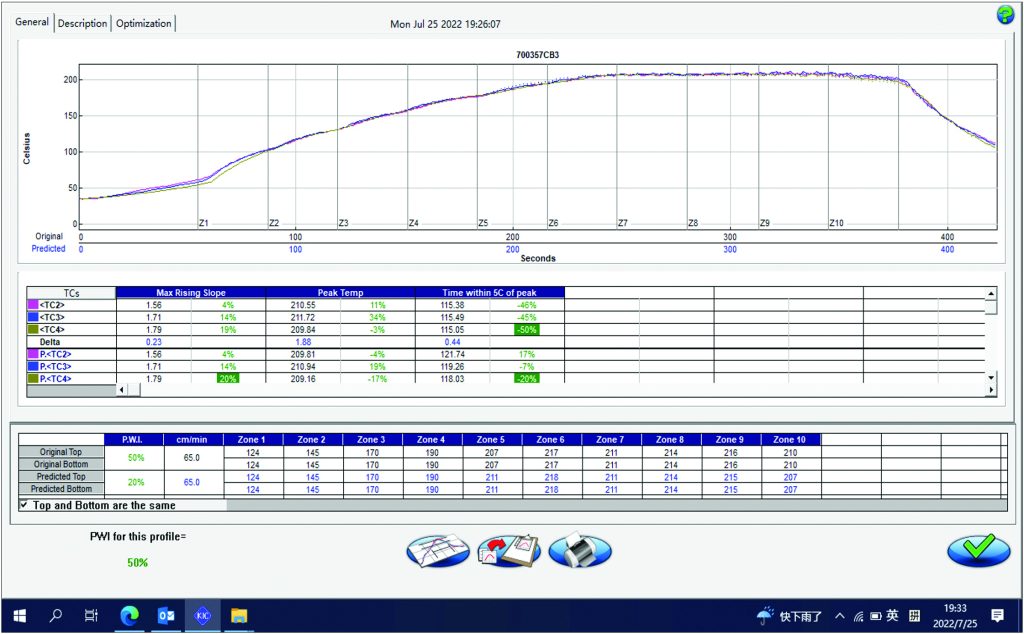
Profile 6
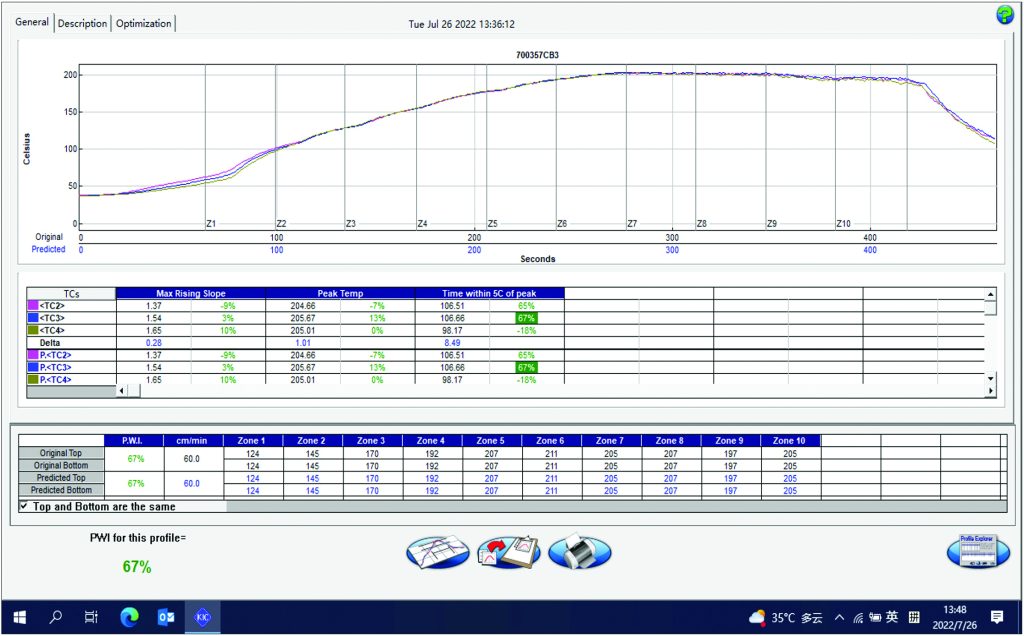
Profile 7
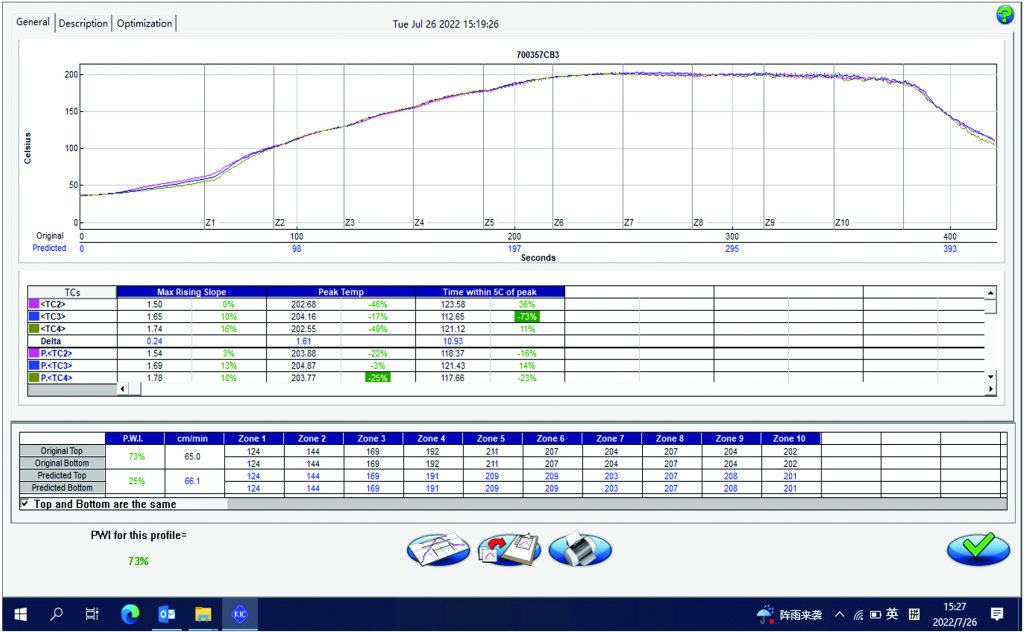
Profile 8
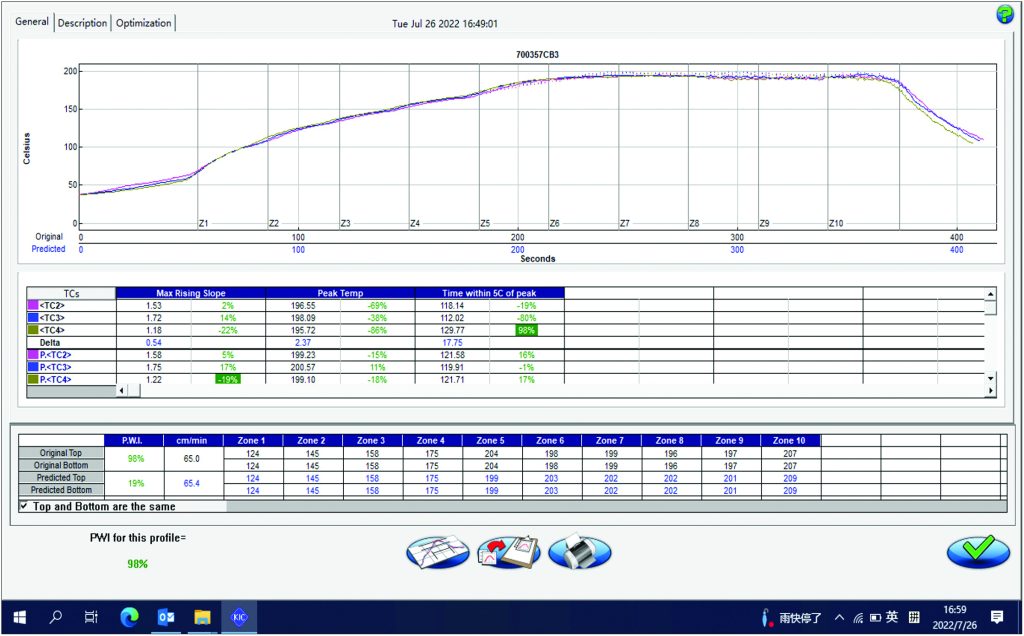
Profile 9
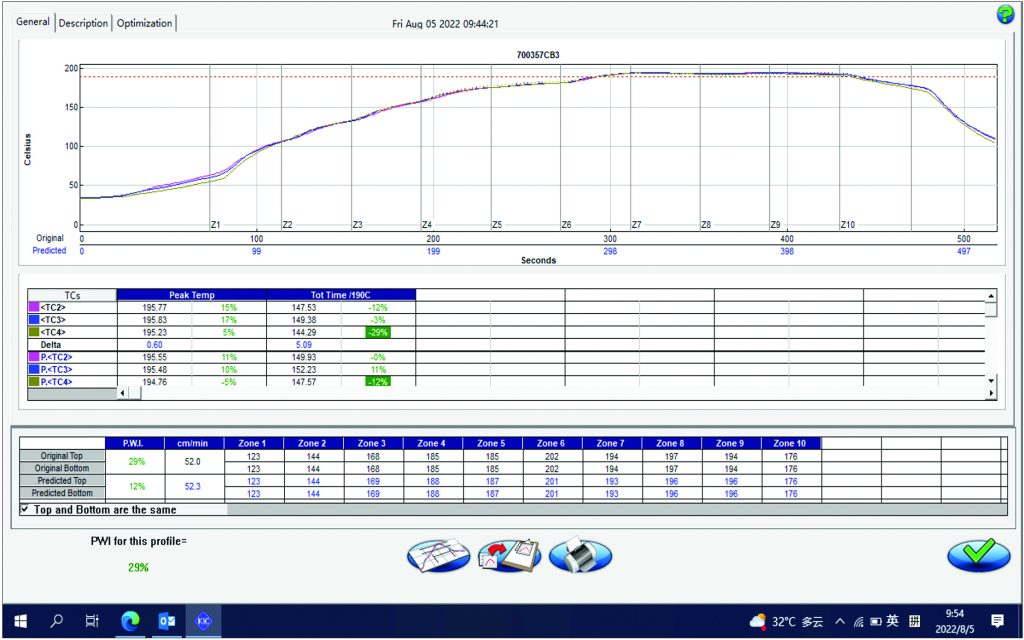
Profile 10
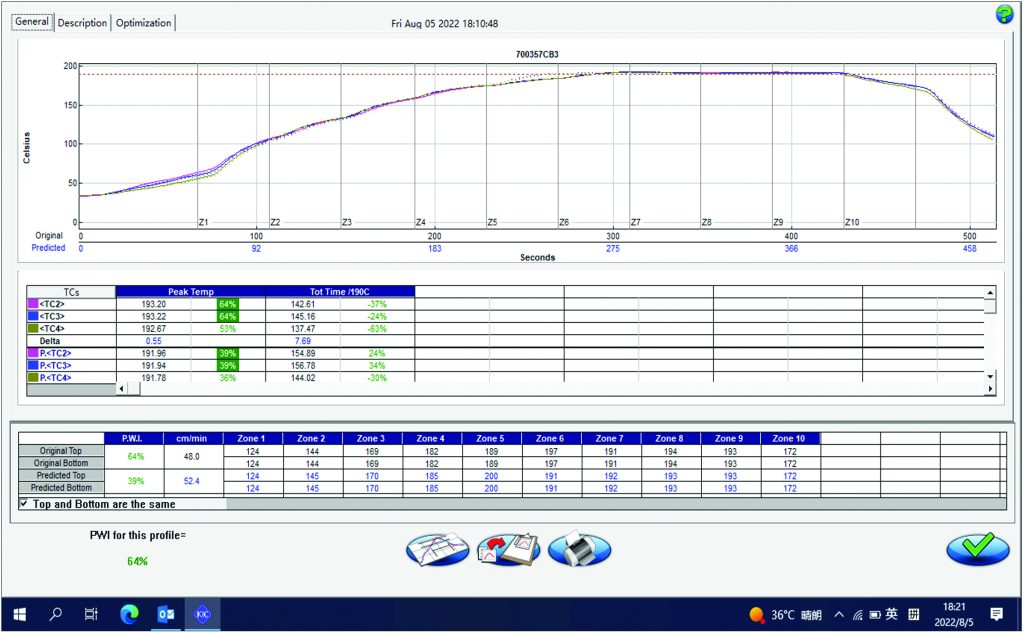
Profile 11
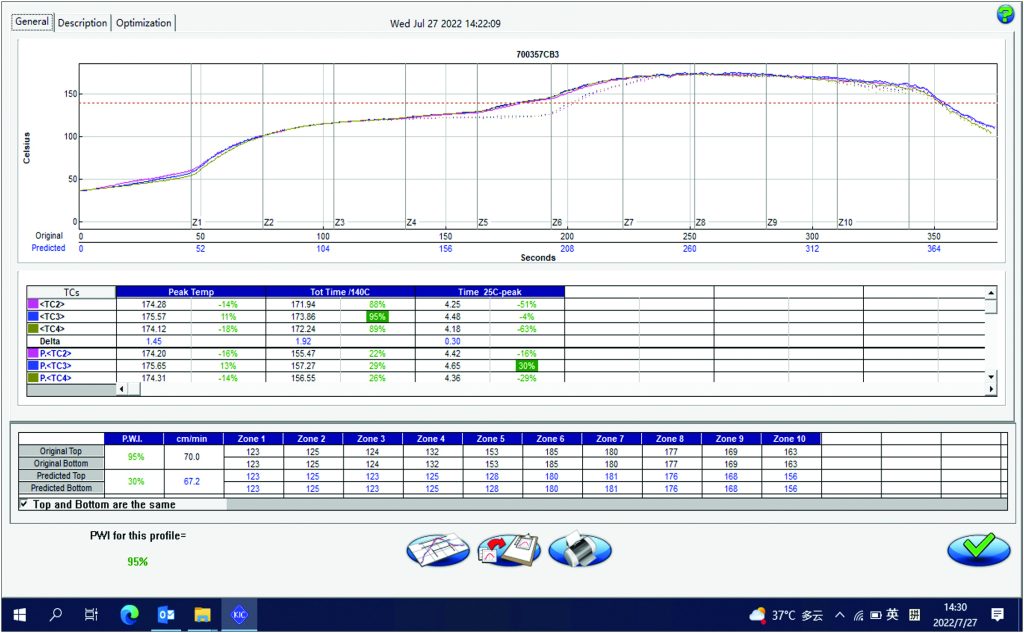
ADAM MURLING

Adam Murling, Technical Services Manager – USA, leads the Americas Technical Service team. This includes hiring, training, coaching, and managing the team to realize its full potential.
He also supervises the team’s project work to ensure exceptional technical excellence is delivered to Indium Corporation’s current and prospective customers.
Adam joined Indium Corporation in 2014 as a Technical Support Engineer. During his time with the company, he has authored multiple tech papers and published several blog posts. He was a recipient of the 2018 Silver Quill Honorable Mention Award and the 2020 Silver Quill Best Paper Award. He was also the moderator for Indium Corporation’s inaugural InSIDER Series webinar. Murling received his bachelor’s degree in chemical engineering from Clarkson University, where he also completed the Master of Science in Engineering Management (MSEM) Program. He is also a Certified SMT Process Engineer (CSMTPE). Full biography: www.indium.com/biographies


