1 About partial discharge
Partial discharge (PD) is an electrical discharge that does not completely bridge the insulation between electrodes. It can occur due to the gas filled void in solid insulation or a bubble in a liquid insulator. PD often appears in a variety of parts of the power systems like switchgears, insulators, transformers, cables, etc.
PD can be classified into three main types: Internal PD, Surface PD, Corona PD. Internal (or Void) PD occurs inside insulation and is most often caused by defects in the solid insulation of cables, bushings, GIS(Gas Insulated Switchgear) and Junction insulation. This type of discharge is highly destructive to insulation and can expand until it causes complete failure. Surface PD occurs across the surface of insulation and Corona PD is from a sharp electrode into gas.
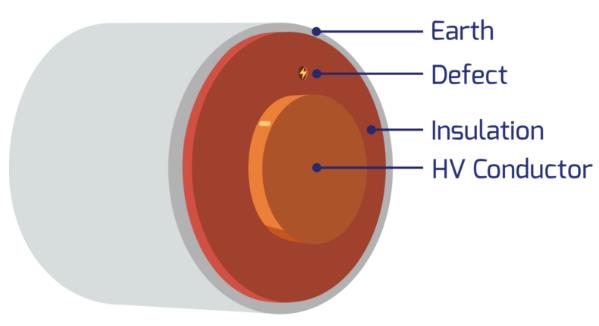
Figure 1 below shows the cross-sectional view of a cable. The defect in the insulation between two electrodes, HV Conductor and Earth, can cause Internal PD.
2 Partial discharge measurement
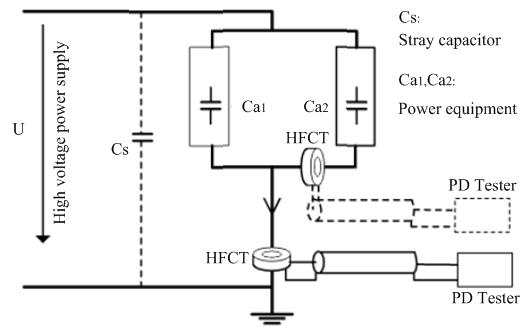
Several methods, such as ultrasonic, electromagnetic field, high frequency current transformer (HFCT), can be used to measure partial discharge. The HFCT method involves using a high frequency current transformer and an oscilloscope to acquire the high frequency current pulse generated during partial discharge.
As figure 2 shows, some unexpected capacitors are created in a conductor if there is a void in the insulation. Consequently, a high frequency current pulse is generated along the cable due to the charging and discharging of these capacitors. These defects can be detected and analyzed by testing the high frequency current pulse.
Figure 3 shows a schematic diagram of PD detection for power equipment using HFCT method.

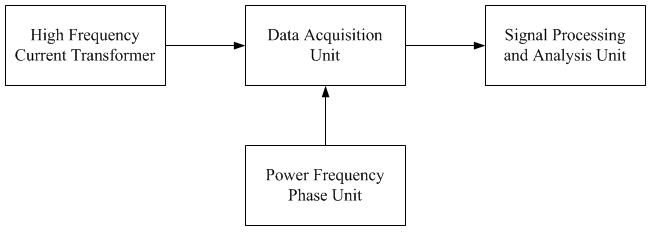
A PD detector system with HFCT method generally consists of a high-frequency current sensor, a power frequency phase unit, a signal acquisition unit, and a signal processing and analysis unit. PicoScopes are popularly used as a data acquisition unit in PD detector system. Figure 4 shows the schematic diagram of a typical PD detection system.
PRPD (Phase Resolved Partial Discharge) and PRPS (Phase Resolved Pulse Sequence) are two typical graphs to be measured by PD testing or detection system.
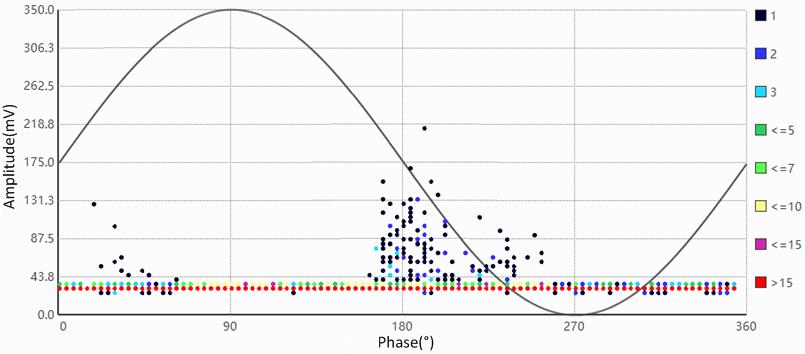
PRPD graph shows the PD activity relative to the 360 degrees of an AC cycle. As the primary voltage on a power system rises and falls over time, the voltage applied across each defect also rises and falls over time, causing the defect to discharge only at certain times and amplitudes. This creates the PRPD graph. Figure 5 shows a PRPD graph of PD. Different colors represent the number of PD events occurred in certain phase angle and amplitude. The horizontal x-axis is the phase angle of the power system under test and the vertical y-axis is the amplitude of PD pulses.
PRPS is a 3D graph. The X-axis represents the power frequency cycle from 0 to 50, the Y-axis represents the phase from 0 to 360 degrees, and the Z-axis represents the discharge amplitude.

3 Why PicoScopes?

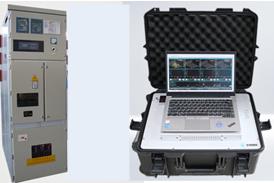
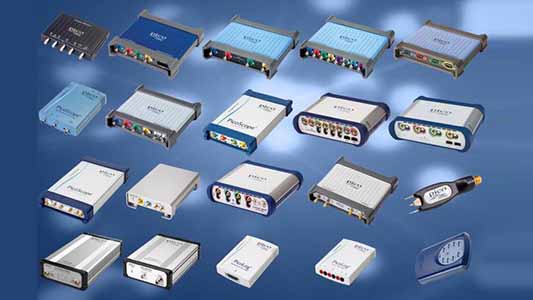
PicoScope models like PicoScope 3000D, PicoScope 5000D, PicoScope 4824A, PS 4444, PicoScope 6000D/E are popularly used in PD testing or detection systems for different kinds of partial discharge.
Figure 8 shows two PD testing systems with PicoScope built-in. The customer develops their own application software in programming languages such as LabVIEW and Python based on Pico SDK.
The main reasons for integrating PicoScopes into their PD testing systems are the unique advantages and powerful capabilities of PicoScopes.
- High reliability
Established in 1991, Pico Technology has been focusing on the development and manufacture of PC-based test instrument and data acquisition equipment. Decades of product iteration and stringent quality controls make PicoScopes highly reliable.
- Cost-efficiency
Unlike benchtop instruments, PicoScopes do not have a PC in the box, which gives them more unique hardware advantages due to their simple structure. This Includes high bandwidth/sampling rate, deep memory, high/flexible ADC resolution, multiple analog and digital inputs, fast speed, etc. Utilizing the full capability of an external PC allows PicoScopes more software capabilities, including 30+ serial decoders, advanced math functions (FFT, filters, measurements plotting, etc). Additionally, the wide range PicoScope models makes it easier for customers to find one that is affordable and suitable for their applications.
- High/Flexible ADC resolution
PicoScopes offer a wide range of vertical resolution options from 8 to 16 bits. Higher resolution provides greater vertical accuracy and the dynamic range. Pico’s breakthrough ADC technology allows users to switch from 8 to 16 bits in one unit.
- Fast and powerful SDK
PicoScopes provide a level of interconnectivity and customization that is usually unavailable on most benchtop oscilloscopes. The SDK (Software Development Kit) allows users to create custom applications for their particular projects, making PicoScopes more than just regular oscilloscopes. Under the SDK, PicoScopes perform better such as acquiring and transmitting data continuously to PC at speeds up to 312 MS/s; The memory can be segmented up to 2 million; users can set the advanced triggers and generate waveforms programmatically. Programming with SDK is simple and easy. Our professional technical support team is always ready and lots of code examples can be found in github.com/picotech.
All Pico products, including PicoScopes come with a free-of-charge SDK. The SDK includes drivers for Windows, macOS, Linux and Raspberry Pi (ARM7). It allows users to write their own software to control the instruments with popular languages such as C, C#, C++, Python, MATLAB, LabVIEW and Microsoft Excel.
- Compact and portable units
Unlike traditional benchtop instruments, PicoScopes are compact, light and portable. When used with a laptop computer, a PicoScope allows you to carry a complete electronics toolset in one bag with your PC. And small size also makes PicoScopes easier to be integrated into the systems with almost no increase in weight or size.


