1 About total harmonic distortion (THD)
Total Harmonic Distortion (THD) is an indicator for evaluating the nonlinearity of a system. Total harmonic distortion (THD) can be measured by applying a standard sine wave to the input of a system and measuring the ratio of the total energy of all harmonics excluding the fundamental wave (first harmonic) to the energy of the fundamental wave (first harmonic) of the signal in the output of the system. Figure 1 below shows a schematic diagram of the waveform spectrum with harmonics in the output of a nonlinear system. In the figure we assume the frequency of the sine wave for the input of the system is f.

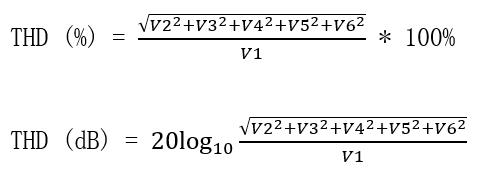
THD definition and calculation formula in PicoScope 7 is as below:
2 Test THD with PicoScope
The following are the steps for THD testing using PicoScope 5444D oscilloscope and PicoScope 7 software. Pico’s MSO training and demonstration board is used to generate a sinusoidal signal with harmonics as the signal under test. PicoScope 5444D and PicoScope 7 software are used to acquire the signal and do the THD measurement.
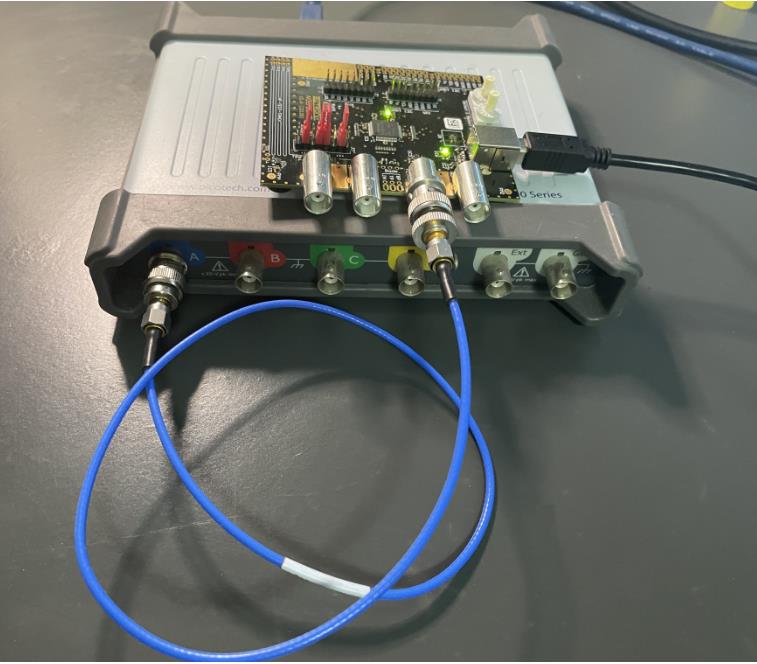
(1) Do the test setup as shown in Figure 2. Select “0” for “Select 1 control knob” and select “F” for “Select 2 control knob” in the demo board. Connect the output of “DAC FLT” in the demo board to CH1 of PicoScope 5444D.
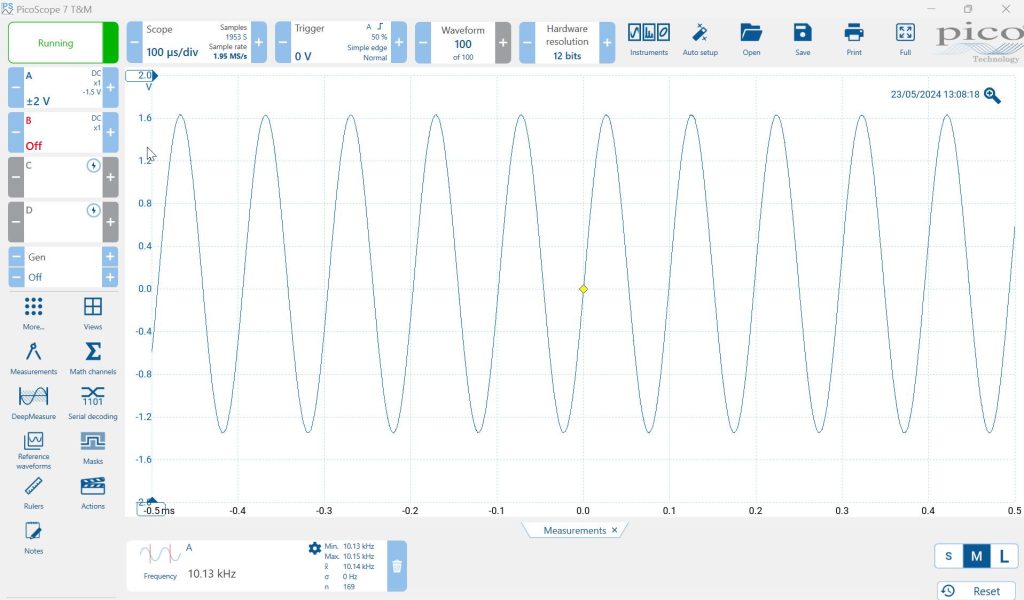
(2) Display the waveform in PicoScope 7. The following settings can help get the THD measurements with better accuracy: a) Make full use of the vertical scale range for the waveform display as possible as we can by setting the vertical scale and offset accordingly; b) Configure PicoScope 5444D to work under high resolution mode like 12bits or 16bits. As shown in Figure 3, PicoScope 5444D’s hardware resolution is set to 12bits. Its vertical scale range is set to +/-2V, and the vertical offset is set to -1.5V. Turn on the automatic frequency measurement parameter in PicoScope 7 and we can see the frequency of the signal is about 10KHz.
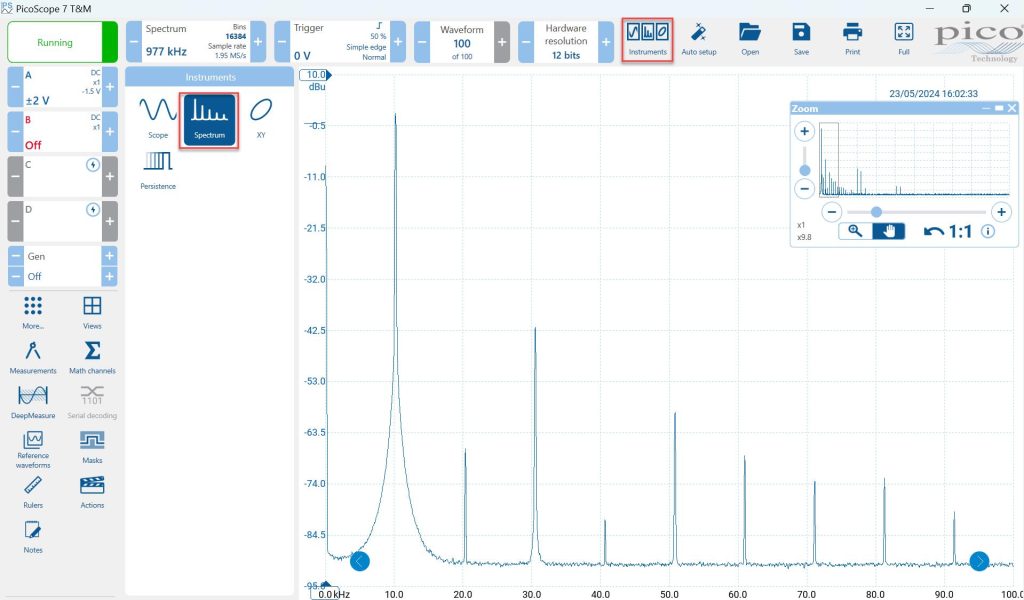
(3) Switch the waveform display in PicoScope 7 from scope mode to spectrum mode. Select Instruments/Spectrum to enter spectrum mode as Figure 4 shown.
(4) Configure the spectrum display mode in PicoScope 7.
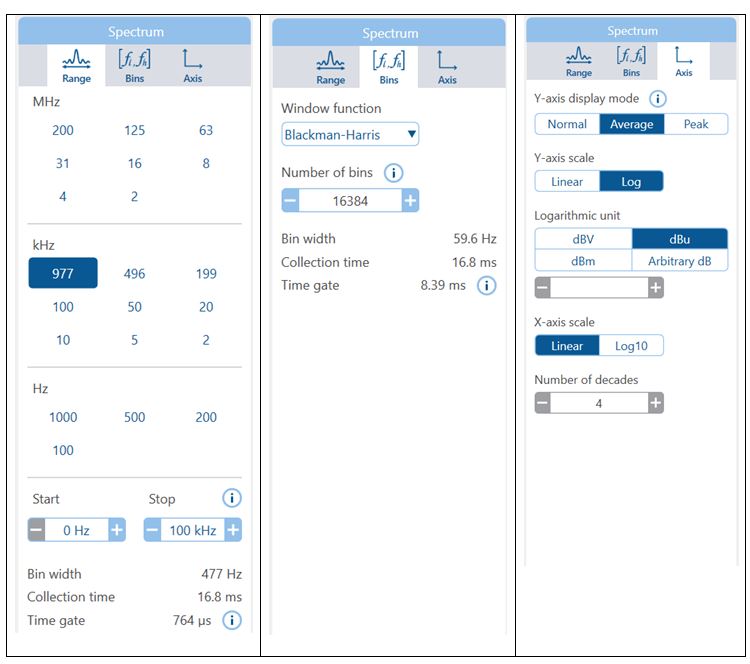
The first step is to set the frequency range. It needs to cover the highest harmonic we need to include for the measurement, and the sampling rate of PicoScope 5444D under this frequency range should not be less than twice the frequency of the highest harmonic in terms of Nyquist sampling theorem. As shown in Figure 5 (left), we set the frequency range of 977KHz and the corresponding sampling rate is 1.95MS/s, which can cover the 100th harmonic of the 10KHz fundamental signal.
The second step is to set the spectrum window function and the number of spectrum bins. Blackman-Harris is recommended to be used as the spectrum window function, which is helpful for differentiating harmonics. The larger the number of spectrum bins, the smaller the spectrum bin bandwidth and the smaller the noise contained in each spectrum bin when the frequency range is fixed. Therefore, it is recommended that the number of spectrum bins should be as large as possible under a fixed frequency range, but it can slow down the testing speed especially when the average mode is used. We need to keep a balance between testing accuracy and speed. As shown in Figure 5 (middle), the number of spectrum bins is set to 16384 and the width of the spectrum bin is 977KHz/16384 = 59.6Hz, and the required collection time is 328ms.
The last step is to set the spectrum display mode. It is recommended that the Y-axis display mode selects “average” to get a more stable and smooth noise floor, thereby to get a more stable THD measurement. Just keep the X-axis settings at their default values.
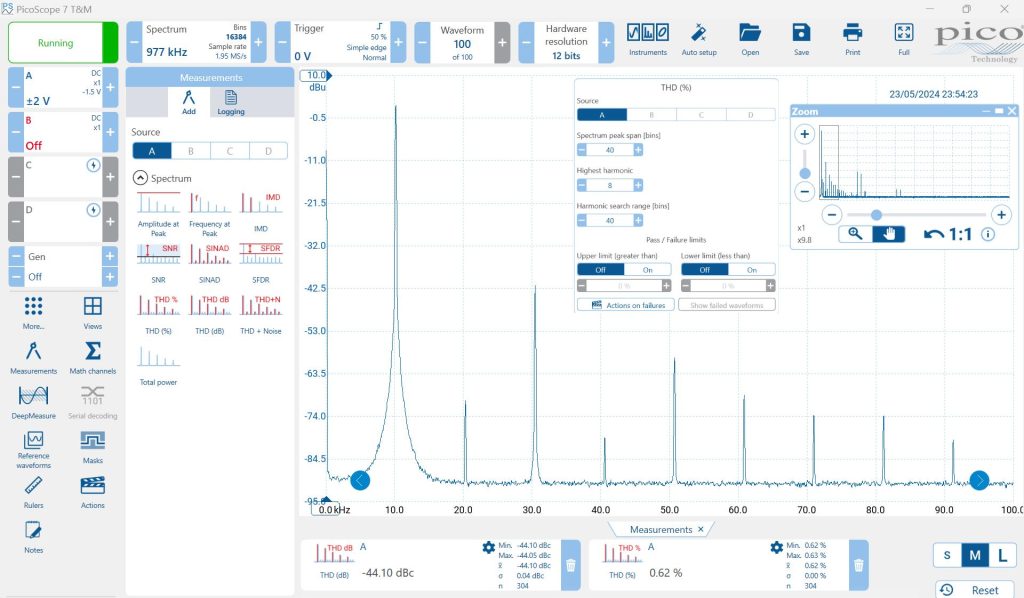
(5) Turn on the Measurements menu in PicoScope 7 and select THD measurement. Set the relevant measurement parameters for THD as below:
Spectrum peak span [bins]: This option tells PicoScope how many spectrum bins are used for spectrum peak searches on either side of the spectrum peak.
Highest harmonic: This option tells PicoScope the highest harmonic that should be included in the measurement.
Harmonic search range [bins]: This option tells PicoScope how many spectrum bins on either side of expected harmonic frequency are used to search for the harmonic peaks.
A key factor affecting THD measurement accuracy is how to accurately isolate the harmonics from noise (the better this is done, the more accurate the measurement will be). The way that the isolation is done is that the spectrum is searched to find harmonic peaks, using a range of bins over which to find each harmonic, and using a fixed level to separate the noise (which will be ignored) from the signal content. The software is very capable of finding the noise level, but the search is made around the frequency that each harmonic is expected, and if this is too wide then it is likely to contain some spurious frequency components that are not harmonics (which could be inter-modulation, cross-talk or otherwise induced components), which will reduce the accuracy. So, using only a few bins for ‘Harmonic Search Range’ and ‘Spectrum Peak Span’ is best, and having narrow bins helps further.
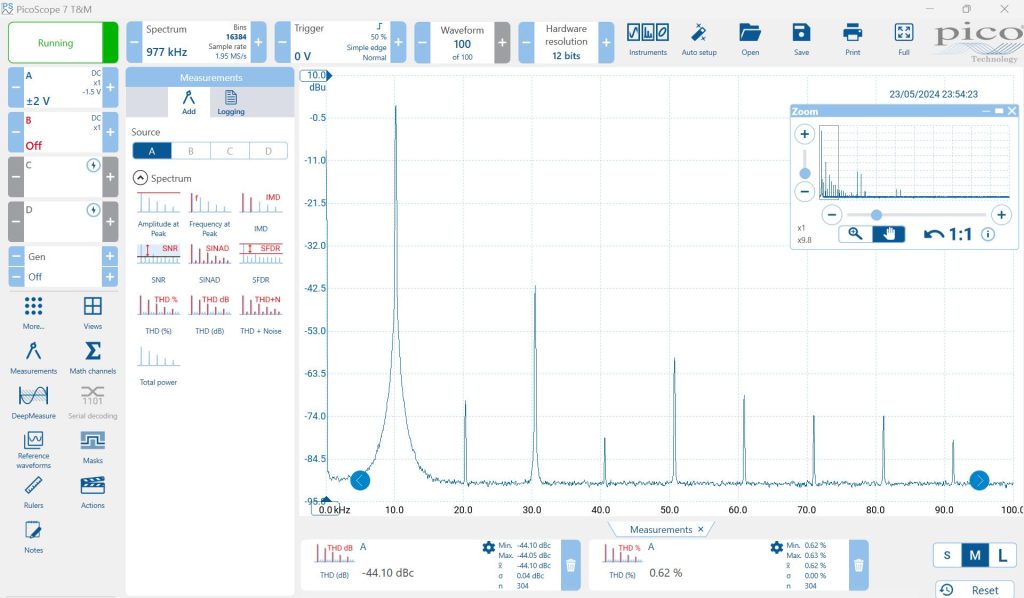
Figure 6 and 7 show the THD measurement and its settings in PicoScope 7.
3 About Pico Technology
Pico Technology is a global leading manufacturer of high-performance electronic test instruments. Rooted in the strong engineering heritage of Cambridge (UK), Pico has achieved 32-year consecutive growth since its founding, through creating and leading the innovative PC-based test instruments. Its unique solutions and complete product lines provide electronic engineers high-performance yet cost-efficient tools that covers the entire design-validation-test cycle, from physical to protocol layers:
Realtime oscilloscopes with built-in AWG, FG, logic analyzer, spectrum analyzer, serial protocol analyzer, offer up to 16-bit ADC resolution, 4G ultra-deep memory, 8 high resolution channels, and true differential probing. Compact 30GHz sampling scopes enable engineers to easily achieve TDR, eye-diagram, clock recovery. PicoVNA, Synthesizer, and PicoConnect probes expand to RF applications, in addition to the best-sold Pico Logger families.
SDK allows users developing custom applications with other instruments realizing test automation. Lifetime free software and 5-year warranty protect customers’ investment.
Pico Technology is the future.
Know more about Pico Technology and its products, please visit: www.picotech.com or email: pico.asia-pacific@picotech.com.


